Flourish: What It Does, Pricing and Alternatives
Flourish is a no-code tool for interactive charts and data stories. The free plan is strong, but paid pricing is quote-only.
Flourish is a no-code platform for interactive charts, maps and data stories. It takes a table of numbers and turns it into a chart a reader can click, filter and explore. It suits newsrooms, marketers and analysts who want a chart that earns a citation instead of a flat image.
TL;DR
- Flourish is free to start, with unlimited projects and the full template range on the free plan.
- Paid plans are quote-only, and the Presenter plan comes through Canva Business or Enterprise.
- Free publishing is public and carries Flourish attribution, so removing it needs a paid plan.
Quick facts
| Fact | Detail |
|---|---|
| What it does | Builds interactive charts, maps and data stories |
| Best for | Newsrooms, marketers and analysts who publish data |
| Starting price | Free; paid plans are quote-only |
| Free option | Free plan, unlimited projects |
| Website | flourish.studio |
| Checked | November 2026 |
What Flourish does
Turn a spreadsheet into an interactive chart
Flourish starts with one of more than 50 templates, covering bar charts, interactive maps, Sankey diagrams, data explorers and timelines. You paste or upload data, then adjust colours, labels and layout in the web app. A reader can hover over a bar to see the exact value, filter a map by region, or follow a flow through a Sankey diagram.
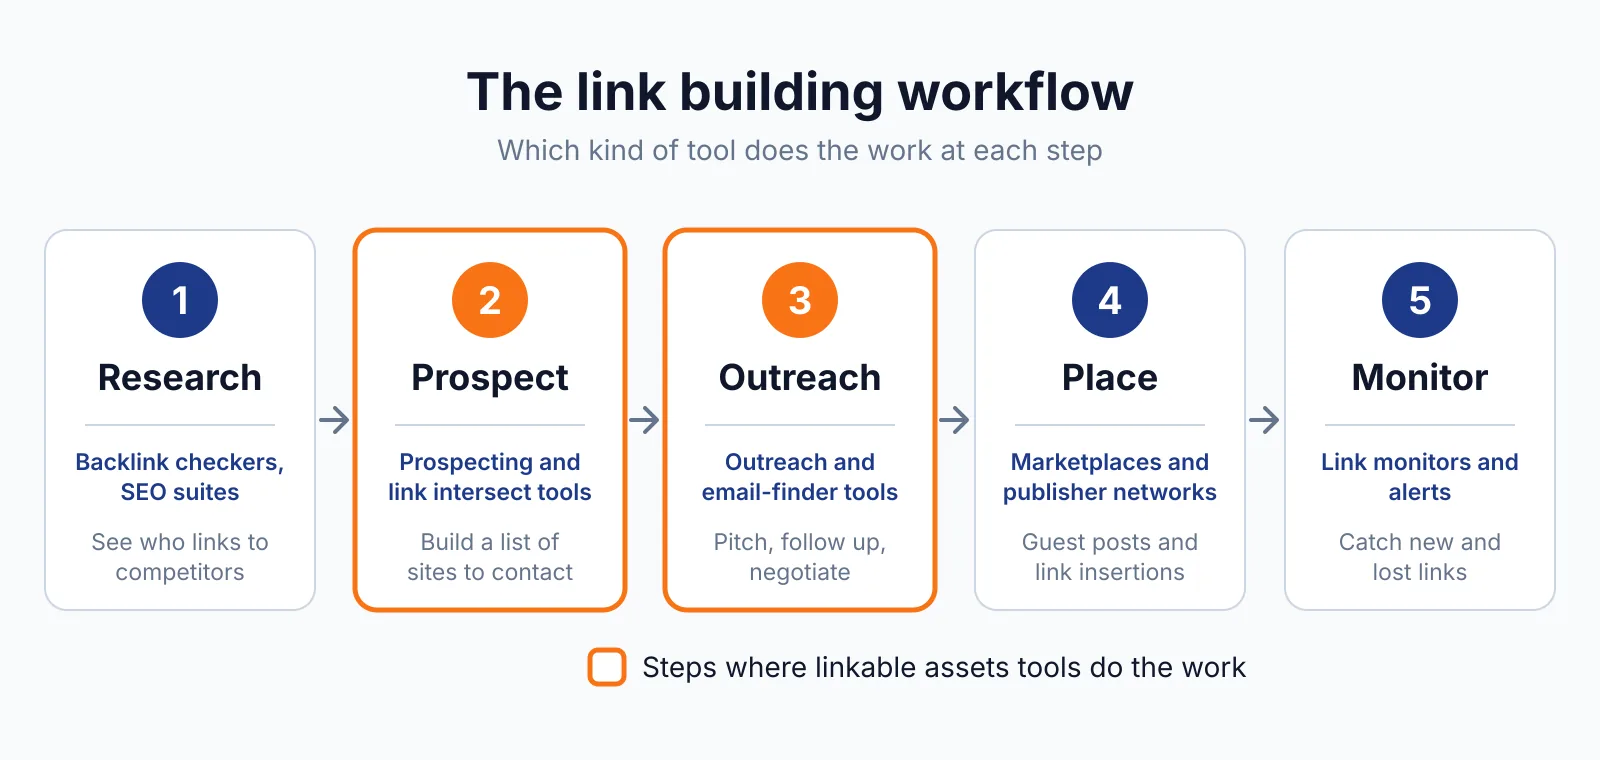
For example, a SaaS team can publish a chart of pricing changes across 20 tools, with a filter by plan type. A journalist who cites that chart links to the page that holds it, and the link goes to your site. See how that page fits a guest posting plan before you publish it.
One limit is scope. Flourish communicates findings rather than analysing data, so it sits beside a BI tool instead of replacing one.
Publish a chart that other sites can embed
Flourish charts publish online and embed responsively on a website, and the embed stays interactive. A pricing index that updates every month can stay on one URL, and every link it earns keeps pointing at the same live chart. That is the link insertion angle.
One limit is attribution: free publishing carries Flourish attribution.
Keep a data story fresh with live data
Paid plans add live data updates through Google Sheets or a public CSV file. When the source sheet changes, the chart updates on its own. For example, a monthly survey tracker can refresh itself from a sheet, so the team spends its time on the write-up instead of redrawing the chart. Check the price checker before you commit to a paid plan, since no dollar price is published.
One limit is access. Live data updates need the Publisher plan or above, so the free plan cannot do this.
Pricing
Flourish publishes no dollar prices for its paid plans, checked November 2026, on its pricing page. The free plan costs $0 and includes unlimited projects, the full template range, privacy for unpublished work, and public publishing with Flourish attribution.
Presenter comes with a Canva Business or Enterprise plan, billed through Canva, and adds charts inside Canva and PowerPoint, plus image and SVG export. Publisher is quote-only and adds team features, attribution-free website embeds, scrollytelling, a custom theme, live data updates and HTML export.
Enterprise is also quote-only and adds security, SSO, custom themes, a live rendering API, a dedicated manager and SLAs. A figure of about $999 a month for Publisher circulates in third-party listings, but we could not verify it on the official page, so treat it as unverified. Older listings showing $15 to $69 per user a month are outdated.
Pick it if
- You publish data often and want charts readers can explore
- Your team already uses Canva and wants charts inside its designs
- You need a chart that stays live and updates from a sheet
Not a fit if
- You need a published dollar price before you talk to sales
- You only need one static chart for a single post
- You need to analyse data, not just present it
Alternatives
| Tool | Why people switch | Pricing |
|---|---|---|
| Datawrapper | Simpler charts built for newsrooms | Check current pricing on their site |
| Infogram | Interactive charts with a lower paid entry point | Check current pricing on their site |
| Visme | Broader design tool with infographics and decks | Check current pricing on their site |
FAQ
Is Flourish free?
Yes. The free plan costs $0, covers unlimited projects and the full template range, and keeps unpublished work private. Publishing is public and carries Flourish attribution. Canva acquired Flourish in 2022.
Does Flourish help with link building?
It buys, places or guarantees no links. An interactive chart published on your own site is a linkable asset, and other sites link to the page that holds it, much like the charts in our Datawrapper overview. Google treats links bought for ranking as link spam unless they carry rel="sponsored" or rel="nofollow", as set out in Google Search Central.
Next step
If you want a chart that earns citations, try the free plan on one data set, then get in touch, browse our free tools and read our Visme overview to compare design tools.
The BacklinkPrice Team researches backlink prices, publisher sites and link building tools. We check prices and plans against each provider's own pages and date them, so you know how current the numbers are.
More from BacklinkPrice TeamRelated guides