How to Get Backlinks from Data Visualizations: A Practical Guide
Turn sourced data into one clear chart or map, host it on its own page with methodology and a clean embed credit, then pitch writers who need it.
You get backlinks from data visualizations by turning a clear, sourced dataset into a chart or map that answers one question at a glance, hosting it on its own page with an easy embed and attribution, and pitching it to writers who cover that topic. Writers link to visuals that save them work and make their article more convincing.
Key takeaways
- A linkable data visualization answers one specific question with trustworthy data and is easy to reuse.
- Host every visual on its own page with the method, sources, and a short summary, so writers link to the page, not just the image.
- Offer an embed code with a plain brand-name credit link; Google's spam policies warn against keyword-rich links hidden in widgets.
- Public data from government and research sources is often enough; you add value by cleaning, combining, and explaining it.
- Original data and charts are also useful for AI answers, which tend to cite specific, sourced figures.
What makes a data visualization linkable
A linkable data visualization is a chart, map, or graphic that other writers want to cite because it shows something new or makes complex data easy to grasp.
Strong examples share 4 traits:
- One clear message, such as "Rents rose fastest in these 10 cities".
- Credible data, with the source and date visible.
- Clean design that reads well on mobile.
- Easy reuse, through an embed code or a downloadable image with credit instructions.
A visualization is a type of linkable asset. It works best when it supports articles writers already plan to publish.
Why data visualizations earn links
Writers need evidence, and a good chart is evidence they can drop into their article. Visuals also travel well on social media and in newsletters, which leads to more discovery.
Most content gets no links at all. In a Backlinko and BuzzSumo study of 912 million blog posts, 94% had zero external links. Data and visuals are among the formats that stand out from that crowd.
Being cited also spreads your brand name. An Ahrefs study of 75,000 brands in 2025 found branded web mentions correlated at 0.664 with AI Overview visibility.
AI search also favors specific, well-sourced information. Google's guidance on creating helpful content asks whether content provides original information, reporting, research, or analysis.
Where to find data for visualizations
You do not always need your own survey. Good sources include:
| Source type | Examples | Best for |
|---|---|---|
| Government statistics | National statistics offices, census data | Local and national trends |
| Open data portals | City and country open data sites | Maps, local stories |
| Research datasets | Universities, nonprofits | Industry and social topics |
| Your product data | Anonymized usage or customer data | Original insights |
| Surveys you run | Customer or panel surveys | Opinions and behavior |
The U.S. government's Data.gov catalog, for example, lists a very large number of public datasets.
Projects such as Our World in Data publish research data and charts under open licenses. Always check the license and cite the source.
Step-by-step: how to earn links with data visualizations
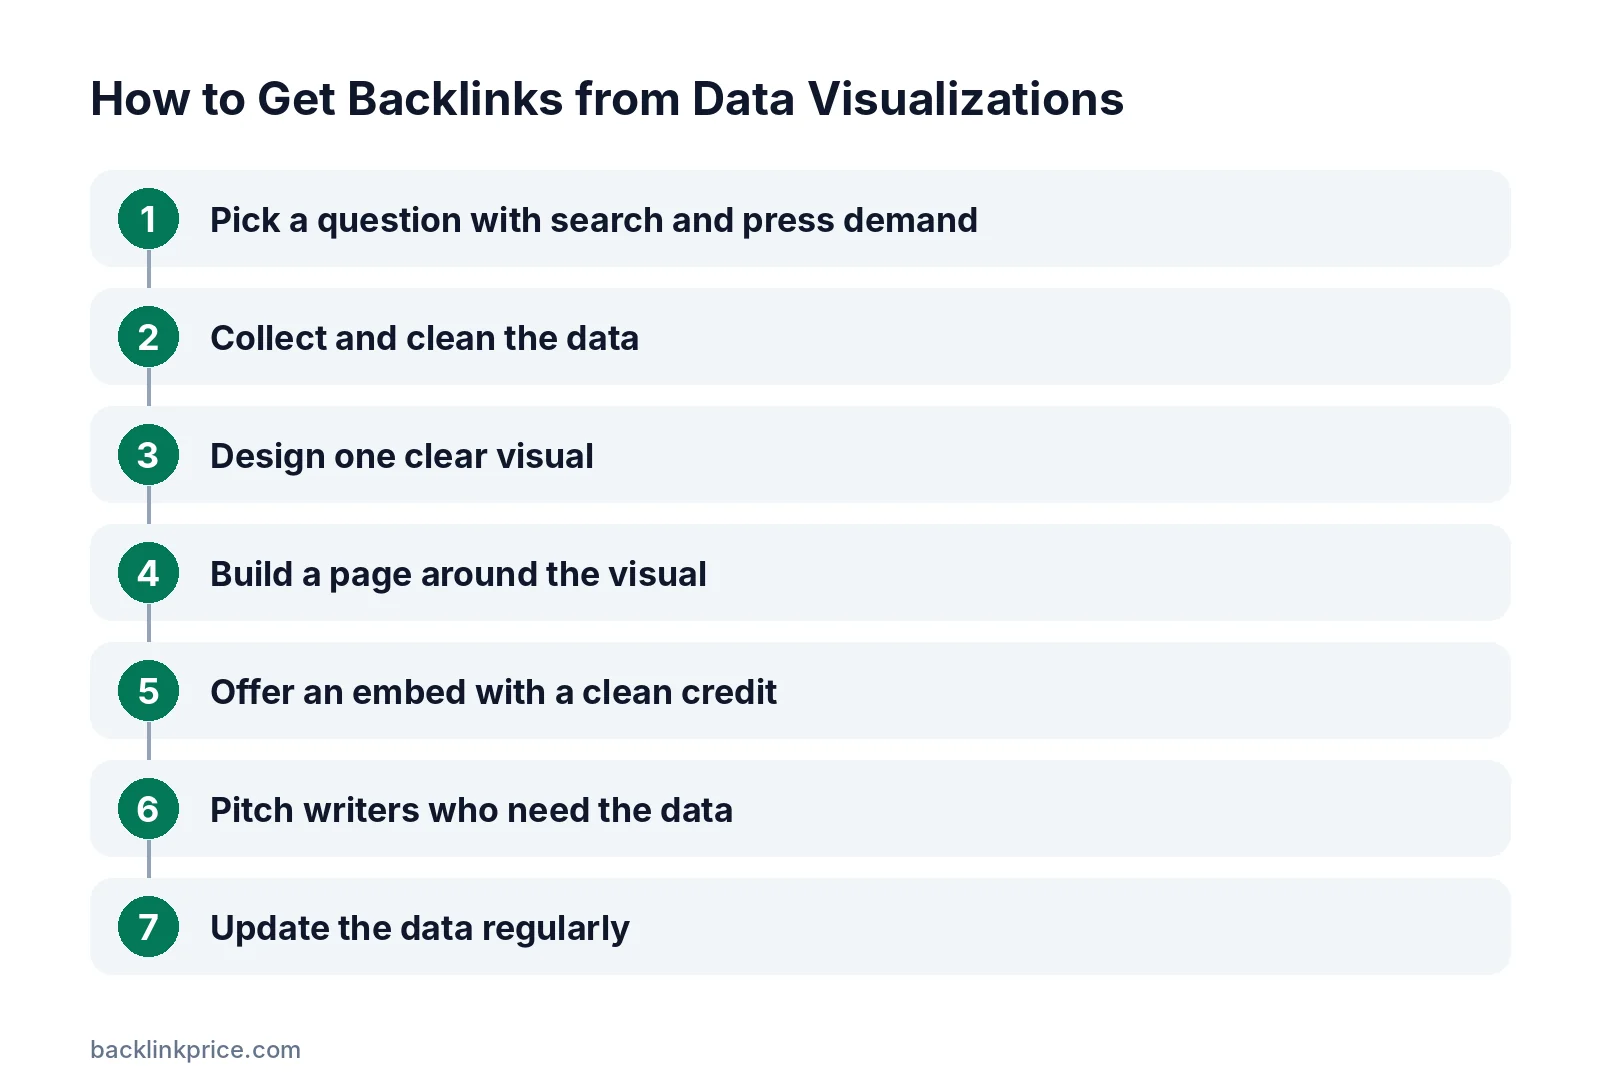
Start from a question writers are asking, not from the data you happen to have.
Step 1: Pick a question with search and press demand
Look for questions journalists and bloggers cover repeatedly in your niche, such as costs, trends, or rankings by location. Check which articles already rank and what data they lack.
Step 2: Collect and clean the data
Download the data, check for errors, and document every step. Keep a short methodology note with sources, dates, and any adjustments.
Step 3: Design one clear visual
Use the simplest chart that answers the question: bar charts for comparisons, line charts for trends, maps for location. Label axes, units, and the date. Add the source in the graphic itself.
If you need a longer visual format, our guide on how to create an infographic that earns links covers layout and promotion.
Step 4: Build a page around the visual
Create a page with the visual, a 2 to 3 sentence summary, key findings as bullets, the methodology, and a downloadable version. Add a short FAQ for common questions.
Step 5: Offer an embed with a clean credit
Provide embed code that shows the visual and a plain credit like "Source: YourBrand". Keep the anchor as your brand name.
Google's spam policies list keyword-rich, hidden, or low-quality links embedded in widgets distributed across sites as link spam.
Step 6: Pitch writers who need the data
Find recent articles on the topic and email authors with one finding and the visual. For journalists, include the data and methodology up front.
See how to get backlinks from journalists for pitching tips.
Step 7: Update the data regularly
Refresh the visual yearly or when new data comes out. Updated data gives writers a reason to cite you again and keeps old links valuable.
A set of related charts can grow into a full statistics page; see how to get backlinks with statistics pages.
Common mistakes
These mistakes stop visualizations from being cited.
- Charts that try to show too much at once.
- No source, date, or methodology.
- Visuals that are unreadable on phones.
- Hosting only the image, with no page to link to.
- Keyword-stuffed embed links.
- Never updating the data.
How to measure results
Measure visual assets on links and reuse.
- Referring domains to the visual's page.
- Embeds found on other sites.
- Image search and reverse image search hits showing reuse without credit.
- Mentions in news and newsletters.
When you find your visual used without a link, ask for credit. Our guide on how to get backlinks with images explains reverse image search outreach.
Frequently Asked Questions
Do I need original data to earn links?
No. Public data from government and research sources can earn links when you clean, combine, or visualize it in a way nobody else has. Original data from your product or a survey usually earns more, because writers cannot get it anywhere else.
Are infographics still effective for links?
Long, tall infographics are less popular than they were, but focused charts and maps that answer one question still earn links. Writers prefer visuals they can embed or quote quickly, with clear sources and a page that explains the data.
Should embed links be dofollow?
A plain brand-name credit link in an embed is normal. Avoid keyword-rich anchors or hidden links, which Google lists as link spam when distributed through widgets. If you are unsure, a nofollow credit still brings attribution and traffic.
How often should I update a data visualization?
Update it when new data is released, often yearly for official statistics. Note the update date on the page. Fresh data gives writers a reason to cite the latest version and helps your page stay relevant in search.
What chart types work best?
Simple ones. Bar charts for comparing groups, line charts for trends over time, and maps for location differences work best. Avoid 3D charts and pie charts with many slices, which are hard to read and less likely to be reused.
Sources

The BacklinkPrice Team researches backlink prices, publisher sites and link building tools. We check prices and plans against each provider's own pages and date them, so you know how current the numbers are.
More from BacklinkPrice TeamRelated guides